Primary Science Resources for the National Curriculum
contact@outstandingscience.co.uk | 0151 558 1485
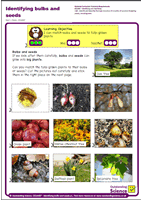
Children learn that bulbs and seeds can grow into mature plants. They match 5 trees and plants to their bulbs or seeds in a cut and stick activity. They identify whether they are looking at a bulb or a seed.
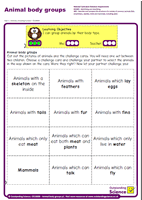
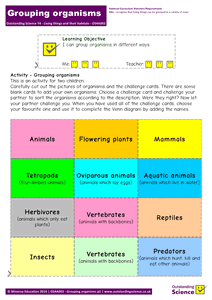
Children play a 2-player game where they draw cards, challenging them to group animals in a variety of ways. Challenge cards include properties such as 'animals with a skeleton on the inside' and 'animals with feathers'.
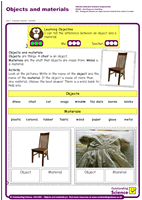
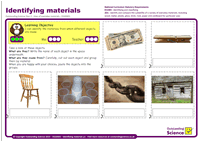
Children learn about the difference between objects and materials. They use a word bank to select the correct object and material for 8 pictures.
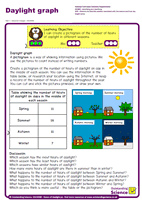
Children use data from a simple table to create a pictogram. They cut and paste the images provided or draw their own symbols.
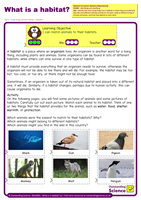
Children learn what a habitat is. They match 6 different animals to their habitats in a cut-and-stick activity. They explain things that the habitats provide the animals with on the writing frames provided.
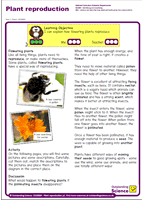
Children learn about the pollination of flowering plants by flying insects. They complete a diagram showing the main stages in the insect pollination process.
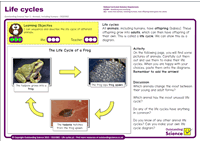
Children learn about life cycles. They match images to the correct place on a diagram and create 3 life cycles of their own.
Children identify the materials from which common objects are made.
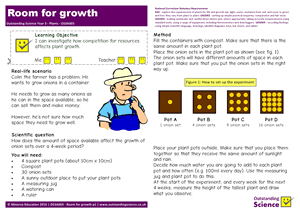
Children grow 1, 4, 9 and 16 onion sets in 4 different pots. They make observational drawings and measure the height of the plants over 4 weeks. They use their measurements to complete a line graph showing the growth of all plants.
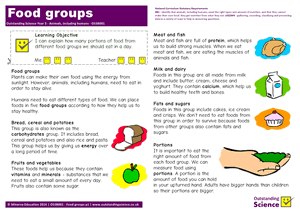
Children learn about the 5 food groups - bread, cereals and potatoes (carbohydrates), meat and fish, fruit and vegetables, milk and dairy, and fats and sugars. They identify some food which belong to each of these groups. They create a pictogram showing how many portions of each food group they should eat in per day. They can cut and paste the pictogram symbols provided, or draw their own.
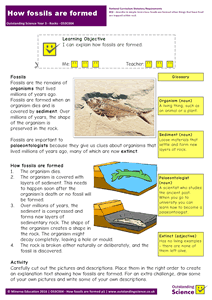
Children explore how fossils are formed in sedimentary rock. They learn that some ancient organisms died, were covered soon after death, formed fossils and were then uncovered. Children create their own process description with diagrams by cutting and pasting, or draw their own diagrams and write their own descriptions.
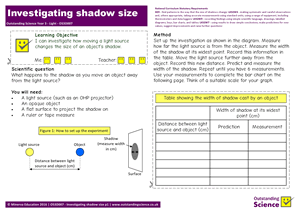
Children investigate how moving a light source affects the size of an object's shadow. They predict and then measure the width of the shadow cast when the light source is at a range of distances. They transfer their results from their table to a bar chart. Finally, they attempt to explain the relationship between light source distance and shadow size.
Children investigate which objects and materials will prevent a paperclip from being attracted to a magnet when placed between them. They attempt to identify the main material each object is made from. They use their results to complete a Venn diagram containing a single set. They attempt to explain their findings.

In this 2-player game, children cut out 24 images of animals and 12 challenge cards. They take turns challenging each other to group the images according to the challenge cards. Groups include tetrapods, herbivores, and mammals. When they have finished, children choose their favourite grouping method and use it to complete a 1-set Venn diagram.
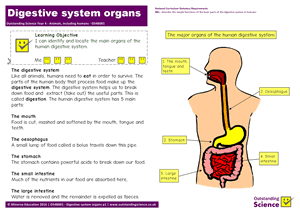
Children learn about the role of the human digestive system. They learn about the functions of the mouth, oesophagus, stomach, small intestine and large intestine. Children cut out pictures of the individual organs and paste them in place to complete a diagram, which they then label.
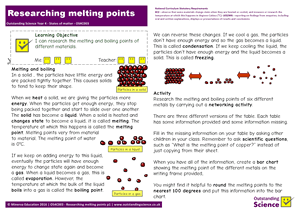
Children learn that many materials other than water will melt if heated to a high enough temperature. They carry out a networking activity, where each child has an incomplete set of information, to find out the melting points of 6 different metals, They record their information in a table and transfer it to a bar chart.
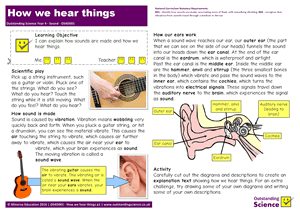
Children learn that sounds are caused by vibrations. They learn that sounds travel from an object, through a medium (usually the air), travel into the ear where they are carried down the ear canal and processed by the brain. Children complete an explanation text explaining how we hear things, by cutting and pasting or writing their own descriptions.
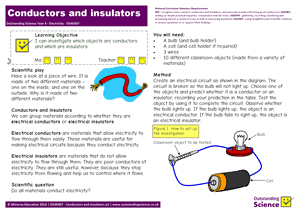
Using simple electrical apparatus, children investigate which materials are electrical conductors and which are insulators. If possible, they note the material each object is made from. Children transfer their results from their table to a Venn diagram containing 2 intersecting sets ('electrical conductors' and 'made of metal') and try to identify a relationship.
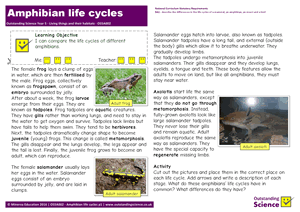
Children learn about the life cycles of 3 different amphibians - frogs, salamanders and axolotls. They create 3 life cycle diagrams, adding their own explanations and diagrams or cutting and pasting those provided. They compare the life cycles of these amphibians.
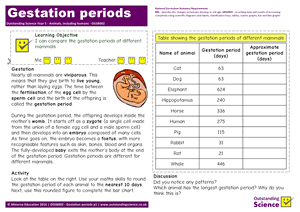
Children complete a table showing the gestation periods of 10 different mammals. They round each gestation period to the nearest 10 days and use this to create a bar chart. They look for patterns and identify which mammal has the longest gestation period.
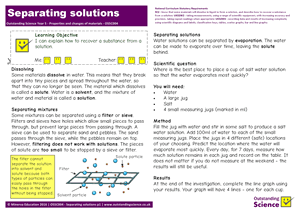
Children investigate the best place to put a cup of salt solution so that the water evaporates most quickly. They choose 4 locations and measure the amount of water in each container over the course of 7 days. They transfer their results to a line graph and use this to answer the question.
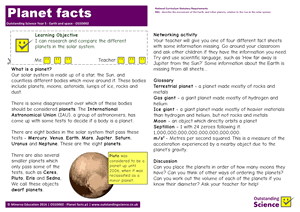
Children learn about 3 different planet classifications - terrestrial, gas giant, and ice giant. They carry out a networking activity where each child has a sheet containing incomplete information and they find out the missing data from their classmates. They discuss various ways of comparing, grouping and ordering the planets.
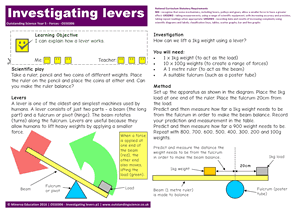
Children set up their own lever, with fulcrum, beam and load, and investigate how far from the fulcrum different forces (weights) need to be in order to balance the load. They transfer their results to a line graph and attempt to find a relationship between the force required and the distance from the fulcrum.
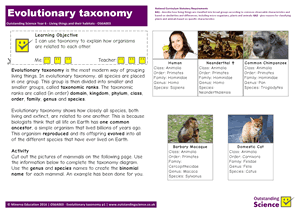
Children learn that evolutionary taxonomy is the most modern way of grouping organisms. They learn that it is a development of Linnaeus' system, but is superior because it shows how closely organisms are related to each other. Children group 5 mammals (including homo sapiens) into an evolutionary diagram. They use this to explain how closely related the other 4 mammals are to modern humans. They work out the binomial (genus-species) name for each organism.
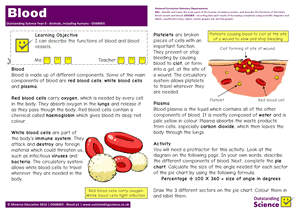
Children describe the functions of red blood cells, white blood cells, platelets and plasma, and create a pie chart showing the percentage of each component by volume in a typical sample of blood.
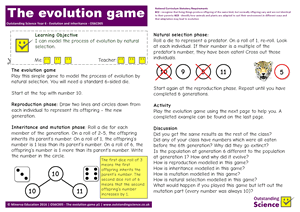
Children play a game, modelling the process of evolution by natural selection. They use a die to model the effects of predation and mutation. They observe how a population can change over time due to these natural processes. They try to explain how these processed are modelled in the game.
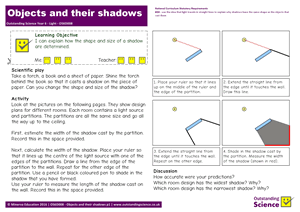
Children use a ruler to draw the shape of a shadow cast by an object on a simple plan diagram. They predict and then measure the width of each shadow, and try to find what kind of set-up produces the widest shadows.
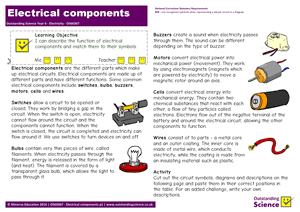
Children learn about the appearance and function of different electrical components, including switches, bulbs, buzzers, motors, cells and wires. They match pictures of each component to their electrical symbols. They cut and paste descriptions of how each component functions, or write their own.
Get access to all of your resources as soon as you subscribe.
Totally secure transactions using PayPal™, Google Pay™, Apple Pay™, or Stripe™ card payments.
Covers every statutory requirement of the National Curriculum.
Join the thousands of teachers worldwide who rely on Outstanding Science to support their teaching.