Primary Science Resources for the National Curriculum
contact@outstandingscience.co.uk | 0151 558 1485
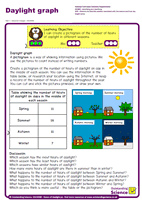
I can create a pictogram of the number of hours of daylight in different seasons.
Children use data from a simple table to create a pictogram. They cut and paste the images provided or draw their own symbols.
2 pages
I can place the months and seasons in order.
Children place the seasons and months of the year in order. They use this information to create a disc showing the sequence of seasons and months.

2 pages
I can match some events to their seasons.
Children look at 9 different events from throughout the year. They place them in the right season.

3 pages
I can explain why we need to wear different clothes in different seasons.
Children look at 25 different items of clothing. They match them to the correct season.

3 pages
I can describe plants in different seasons.
Children look at 9 pictures of plants at different times of the year. They match them to the correct season.

2 pages
I can describe different types of weather.
Children look at 6 pictures of different types of weather. They cut and paste the correct description, or write their own.

1 page
I can explain what the weather is like in different seasons.
Children look at 4 different types of weather and match them to the seasons where they are most likely to see them. They draw another picture of typical weather in each season.

2 pages
I can explain how much daylight we get in different seasons.
Children match 4 timelines showing the Sun's position in the sky to their respective seasons.

2 pages